 |
| db2expln output - statement concentrator active |
Showing posts with label monitoring. Show all posts
Showing posts with label monitoring. Show all posts
Wednesday, July 1, 2015
DB2 Battle: Optimization Profile vs. Statement Concentrator (Part 3)
Friday, February 27, 2015
DB2 Battle: Optimization Profile vs. Statement Concentrator (Part 2)
Today I wanted to try out using DB2 optimization profiles for a statement impacted by the statement concentrator. In part 1 I gave the background, showed how I created an optimization profile and that a simple explain statement didn't return what I expected. In this final part I am going to look at DB2 section actuals to hopefully proof that my optimization guideline works as I had hoped.
Because all my "explain plan for select ..." statements resulted in the same access plan, I decided to use session actuals to look at how statements are really executed within DB2. The actuals are kind of a live log of the real statement execution costs and the applied access plan. The first step towards session actuals is to have a workload and an activity event monitor and to switch the monitor on:
db2 "create workload betw applname('python') collect activity data with details,section"
db2 "create event monitor betwmon for activities write to table"
db2 "set event monitor betwmon state 1"
The above statements create a workload which collects section data. The application name (APPLNAME) is "python" because I use a Python script (see below) for parts of the testing.
Script:
import ibm_db
conn = ibm_db.connect("hltest","hloeser","secretpw")
ibm_db.exec_immediate(conn, 'set current optimization profile="HLOESER"."PROFILE_BETW"')
ibm_db.exec_immediate(conn, 'select id, s from betw where id between 2 and 20')
Thursday, November 20, 2014
Useful DB2 administrative functions and views
Did you know that there are about 80 (eight-zero) administrative views in the SYSIBMADM schema in DB2 that are ready for use? I have used several of them and also looked into the documentation, but 80 is quite a lot. (Almost) All of them are documented in the DB2 Knowledge Center in the "Built-in routines and views" section.
The routines live in the SYSPROC schema, administrative views can be found in the schema SYSIBMADM. Given that insight it is easy to construct a simple query to find all available views:
SELECT viewname from syscat.views where viewschema='SYSIBMADM'
Depending on your version and fixpack level of DB2 the result will vary. Speaking of fixpack level, do you know how to find out what your system is running by using SQL? The view ENV_INST_INFO may help in that case because it returns instance-related information such as the instance name, the DB2 version, fixpack, and build level:
SELECT * FROM SYSIBMADM.ENV_INST_INFO
Are you connected to, e.g., an Advanced Workgroup Server Edition (AWSE) of DB2 or an Enterprise Server Edition (ESE)? Find out by querying the product information using the view ENV_PROD_INFO. It returns the installed product, the kind of active licenses, and more:
SELECT * FROM SYSIBMADM.ENV_PROD_INFO
Next in the list of useful views with system information is ENV_SYS_INFO. It can be utilized to find out more about the operating system, the type of hardware, installed CPU and memory, etc.:
SELECT * from SYSIBMADM.ENV_SYS_INFO
Last, but not least in my list of views with basic system information are DBMCFG and DBCFG. As the name implies can these views help to retrieve the current instance (database manager / dbm) or the current database (db) configuration. So it is easy to find out whether the self-tuning memory manager (STMM) is active or where diagnostic logs are stored.
That's it for today, I am back to playing with more of those views (and routines)...
Wednesday, August 13, 2014
Using some Workload Management for free in non-Advanced Editions of DB2
One of the new features of DB2 10.5 is BLU Acceleration. In introduces a couple of default Workload Management objects that are intended to control heavy queries running against column-organized tables. The objects are automatically created with every database, independent of the product edition. They are only enabled when DB2_WORKLOAD has been set to ANALYTICS before creating the database, i.e., a database for in-memory analytics is set up. But what is available for the regular guy like myself? What can be used for free and as foundation for some monitoring and understanding the system workload? Let's take a look.
Typically I use a DB2 Developer Edition which includes all features including WLM. So I removed the db2de license and organized (being IBMer has some benefits!) a Workgroup Server Edition (db2wse) which I added to the system using db2licm. I also turned on hard license enforcement, so that any attempts of using an unlicensend feature are directly blocked. Here is what db2licm returned thereafter:
mymachine> db2licm -l
Product name: "DB2 Workgroup Server Edition"
License type: "Authorized User Single Install"
Expiry date: "Permanent"
Product identifier: "db2wse"
Version information: "10.5"
Max amount of memory (GB): "128"
Enforcement policy: "Hard Stop"
Number of licensed authorized users: "25"
With that in place I created a new database named WLMTEST and connected to it. My first test was to create a workload object which should not be possible given my DB2 edition:
DB: WLMTEST => create workload freeride applname('xploit')
DB21034E The command was processed as an SQL statement because it was not a
valid Command Line Processor command. During SQL processing it returned:
SQL8029N A valid license key was not found for the requested functionality.
Reference numbers: "".
Ok, this look right. I don't have a license to use DB2 WLM (Workload Manager). My next query was intended to check what service classes are present in my system.
DB: WLMTEST => select varchar(serviceclassname,30), varchar(parentserviceclassname,30), enabled from syscat.serviceclasses
1 2 ENABLED
------------------------------ ------------------------------ -------
SYSDEFAULTSUBCLASS SYSDEFAULTSYSTEMCLASS Y
SYSDEFAULTSUBCLASS SYSDEFAULTMAINTENANCECLASS Y
SYSDEFAULTSUBCLASS SYSDEFAULTUSERCLASS Y
SYSDEFAULTMANAGEDSUBCLASS SYSDEFAULTUSERCLASS Y
SYSDEFAULTSYSTEMCLASS - Y
SYSDEFAULTMAINTENANCECLASS - Y
SYSDEFAULTUSERCLASS - Y
7 record(s) selected.
The DB2 Knowledge Center has an overview of related default WLM objects and which parts can be modified with DBADM or WLMADM authority. Having the names of the system objects I tried my luck altering a work class set to reduce the cost barrier for the managed heavy queries (SYSMANAGEDQUERIES):
DB: WLMTEST => alter work class set sysdefaultuserwcs alter work class SYSMANAGEDQUERIES for timeroncost from 1000
DB20000I The SQL command completed successfully.
The threshold SYSDEFAULTCONCURRENT defines how many of those queries can run concurrently in the system. Why not change that threshold definition?
DB: WLMTEST => alter threshold SYSDEFAULTCONCURRENT when sqlrowsreturned > 20 stop execution
DB21034E The command was processed as an SQL statement because it was not a
valid Command Line Processor command. During SQL processing it returned:
SQL4721N The threshold "SYSDEFAULTCONCURRENT" cannot be created or altered
(reason code = "7"). SQLSTATE=5U037
Well, it seems that you cannot modify the entire threshold to your liking. However, following the documentation on what can be done, I successfully reduced the number of parallel activities.
DB: WLMTEST => alter threshold SYSDEFAULTCONCURRENT when CONCURRENTDBCOORDACTIVITIES > 3 stop execution
DB20000I The SQL command completed successfully.
To test the impact of my changes, I opened 4 different shells, connected to DB2 in each window, and more or less simultaneously executed the following query:
select * from syscat.tables,syscat.columns
I have to restate that I tried to execute it in all four windows. It only ran in three of them. Why? Because the threshold kicked in for this heavy query and stopped the execution for the 4th session ("concurrentdbcoordactivities> 3 stop execution"). So some basic workload management seems to work even without a license.
Can I change the threshold to force the application off, i.e., to not allow running the query?
DB: WLMTEST => alter threshold SYSDEFAULTCONCURRENT when CONCURRENTDBCOORDACTIVITIES > 2 force application
DB21034E The command was processed as an SQL statement because it was not a
valid Command Line Processor command. During SQL processing it returned:
SQL4721N The threshold "SYSDEFAULTCONCURRENT" cannot be created or altered
(reason code = "13"). SQLSTATE=5U037
No, changing the entire definition of the threshold is not possible, but at least parts of it can be modified. You can then use the adapted default WLM objects to better understand what work is running on your system, e.g., testing what would fall into the category of "heavy queries". As a last step, I used a monitoring function to return the CPU time spent by service subclass. Most was in the managed subclass into which my queries from above were mapped:
DB: WLMTEST => SELECT varchar(service_superclass_name,30) as service_superclass, varchar(service_subclass_name,30) as service_subclass, sum(total_cpu_time) as total_cpu, sum(app_rqsts_completed_total) as total_rqsts FROM TABLE(MON_GET_SERVICE_SUBCLASS('','',-2)) AS t GROUP BY service_superclass_name, service_subclass_name ORDER BY total_cpu desc
SERVICE_SUPERCLASS SERVICE_SUBCLASS TOTAL_CPU TOTAL_RQSTS
------------------------------ ------------------------------ -------------------- --------------------
SYSDEFAULTUSERCLASS SYSDEFAULTSUBCLASS 1207794 552
SYSDEFAULTUSERCLASS SYSDEFAULTMANAGEDSUBCLASS 852547 0
SYSDEFAULTMAINTENANCECLASS SYSDEFAULTSUBCLASS 466436 1374
SYSDEFAULTSYSTEMCLASS SYSDEFAULTSUBCLASS 0 0
4 record(s) selected.
With that I leave more testing to you. Happy monitoring!
BTW: The same tests can also be done on the SQL DB service on IBM Bluemix. That service is a DB2 Enterprise Server Edition.
Friday, August 8, 2014
Manage a DB2 database on IBM Bluemix
I recently showed you how to set up a Python-based application that makes use of the SQL DB service (a.k.a. DB2) on IBM Bluemix. Today I give you a quick introduction into what you can do with the DB2 administration interface that is provided as part of the IBM Managed Database Service.
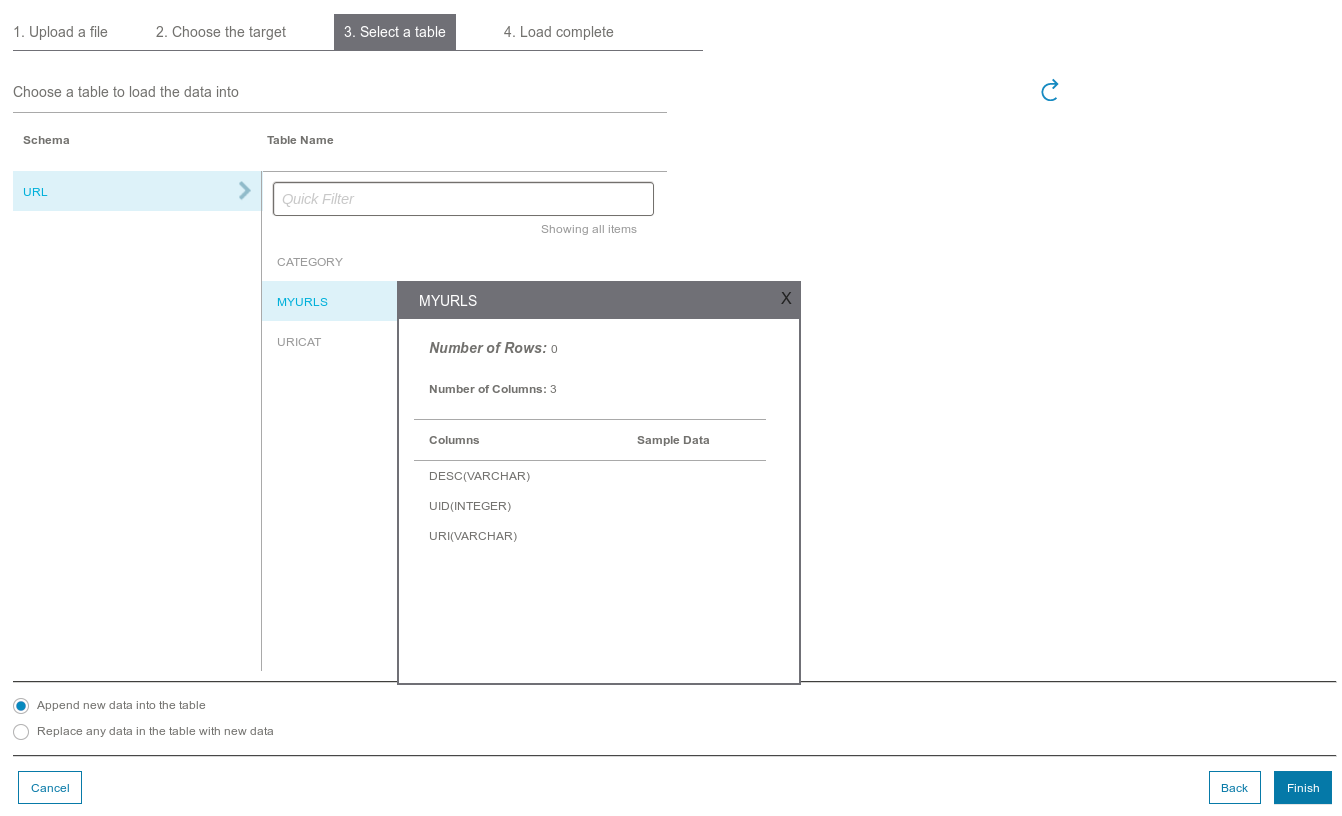
In short, the web interface offers to manage and monitor the database.
Manage means that it is possible to drill down into existing database objects or, by running uploaded SQL scripts, execute DDL statements. Data can be loaded into tables, backup and restore are also offered. The monitor part focuses on watching which applications are connected to the database, what SQL statements have been executed and what is the status of existing tablespaces. A special monitor feature is to run Guardium reports.
I tested the interface in order to create a couple tables for an application I plan to write, then load data. After I succeeded I verified that the objects were in the database, then took a quick tour through the monitoring options. All worked well, but I am missing the feature to run SQL statements or have more monitoring options like offered by the DB2 Technology Explorer. Based on the forum comments there is more to come.
You can try out the interface yourself by signing up for a free trial of IBM Bluemix. What did you do with DB2 on Bluemix so far?
In short, the web interface offers to manage and monitor the database.
 |
| IBM Managed Database Service - Interface |
 |
| Run DB2 DDL statements after uploading them |
You can try out the interface yourself by signing up for a free trial of IBM Bluemix. What did you do with DB2 on Bluemix so far?
 |
| Load data into DB2 tables |
Wednesday, July 23, 2014
Watch this! Move your DB2 monitoring to the in-memory interface (WLM monitoring)
Since its first days as a database management system, DB2 has been been changed. It has been extended by new features to serve customer requirements and has been adapted to the state of the art in hardware and software technology. One major new feature has been the introduction of the DB2 Workload Management in version 9.5 and related more comprehensive monitoring with finer granularity (in-memory metrics monitoring) in version 9.7. As with many product changes, it takes a while for customers to really put them to use and reap the benefits, especially when the existing functionality still works.
Thus I was happy when I saw a new article on IBM developerWorks describing how to move off the (old) snapshot monitoring interfaces in DB2 and to the in-memory metrics monitoring. What is included in the article is an overview of the advantages of the newer interface. This should get you motivated to read the rest of the article (and then to migrate if not done yet). It contains a side-by-side comparison of old and new interfaces and has many sample SQL queries. The queries demonstrate how to obtain DB2 runtime metrics using the old and new interface for some popular monitoring tasks. You can find the documentation of the SQL interface to the in-memory metrics in the DB2 Knowledge Center in this overview. Most of the pages in the manual have further SQL samples to get you started.
So take a look, it will also help you with one of the upcoming DB2 quizzes on this blog.
Tuesday, April 30, 2013
DB2 Quiz: Which command did I run?
I have DB2 installed on my machine and am connected to a single database. In another window I called a DB2 tool and this is the output:
Database Member 1001 -- Active -- Up 4 days 21:04:36 -- Date 2013-04-30-11.24.30.393709
Database Member Memory Controller Statistics
Controller Automatic: Y
Memory Limit: 3202592 KB
Current usage: 482624 KB
HWM usage: 482624 KB
Cached memory: 138816 KB
Individual Memory Consumers:
Name Mem Used (KB) HWM Used (KB) Cached (KB)
========================================================
APPL-HLTEST 40000 40000 38912
DBMS-hloeser 153216 153216 57600
FMP_RESOURCES 22528 22528 0
PRIVATE 9472 9472 0
DB-HLTEST 257280 257280 42304
LCL-p27623 128 128 0
What tool did I use and which parameter? Any guesses?
Wednesday, January 16, 2013
Parents at the playground and DB2 components
Right now it is not the time for outdoor playgrounds in Germany, but nonetheless: Have you ever watched parents on a playground? They make up an excellent analogy to how some of the DB2 components work.
When you are at a playground with a group of parents and kids, usually the kids play and the parents talk. However, as a background process parents (in most cases) take note of what the kids are doing. If one of the own children falls, gets hurt, scratched, has a mouthful of sand, or other health issues, the observing parent arrives, fixes the problem. The child goes back to playing, the parent back to talking.
In DB2 this is called the fault monitor facility. It keeps DB2 up and running in case of "exiting prematurely" (a.k.a. crash). Commands like db2fmcu and db2fm help setting up the facility. Once it is set up, try a "kill -9" on the db2sysc process and see what is happening...
Another interruption to the socializing parents (I want to use that term as this is social media... ;) occurs when the kids cannot get along sharing a showel, a toy car, or are fighting too heavy about something else. In that case, a parent shows up and tries to make sure everyone gets along well again.
In DB2 and other database systems we have a similar concept called deadlock detection. With many DB2 databases now making use of currently committed semantics for the cursor stability isolation level, deadlocks should be rare.
Not the situation as above, but making sure your child is not kept too long in the queue for the swing or other critical playground equipment is another critical aspect of parenting. That concept is called database monitoring and lock waits are something to keep an eye on.
So the next time you are on the playground socializing, tell others about DB2...
Thursday, March 29, 2012
Aero Expo and Database Monitoring
Some years back (is my blog really that old...?) I had written about the AERO Expo, a global general aviation show in Friedrichshafen. Today, I received an invitation/marketing email reminding me about the upcoming expo. Looking over the list of exhibits and demonstrations, it is very similar to database systems or even information management. There is the core product (the aircraft/engine or database system) and then a good chunk is about the tooling and maintenance.
What - to me - stands out is the monitoring. It is critical in flight, to keep both your aircraft and your database system up and flying. I am not a pilot and cannot really comment on what is crucial, but for database systems performance monitoring is a very interesting topic. Did you know that InfoSphere Optim Performance Manager Extended Edition is capable of monitoring the application stack ("end to end monitoring")? To me as a frequent traveller this looks like making sure that both the aircraft is running well as well as understanding what is happening in terms of air traffic and on the ground, i.e., it provides the whole picture, not just a fragment.
Not sure whether I will visit the AERO this year (tickets anyone...?), I would look around to see if something similar to end-to-end monitoring is available.
BTW: For those in Switzerland or South Germany, take a look at this cool project for displaying air traffic.
Tuesday, February 21, 2012
Try MONREPORT to generate monitoring reports
DB2 includes several system-defined modules that can come in handy. One that I would like to point you to is MONREPORT. As the name may hint at it can be used to generate monitoring reports, i.e., to retrieve monitoring data and generate text reports out of the data. Basically, some useful reports with lots of health indicators and statistics are just a call away.
Did you try "call monreport.dbsummary()" yet? Most (all?) the statistics that you need in a single report without any sweat. The module also has procedures to retrieve information about current SQL activities, package cache statistics, lock waits, etc. What is interesting to note is that the monreport procedures utilize the new monitoring infrastructure introduced in DB2 9.7, the MON_GET functions. And if you search the DB2 system catalog, you can even find the sources to the procedures in the MONREPORT modules. Something to take a look at, learn from, and be inspired...
Did you try "call monreport.dbsummary()" yet? Most (all?) the statistics that you need in a single report without any sweat. The module also has procedures to retrieve information about current SQL activities, package cache statistics, lock waits, etc. What is interesting to note is that the monreport procedures utilize the new monitoring infrastructure introduced in DB2 9.7, the MON_GET functions. And if you search the DB2 system catalog, you can even find the sources to the procedures in the MONREPORT modules. Something to take a look at, learn from, and be inspired...
Wednesday, November 9, 2011
Monitoring: Three new for three old monitoring functions
I was reading over the list of new, deprecated and discontinued functionality after DB2 9.7 Fixpack 5 has been made available. What I found interesting is that 3 old snapshot monitoring table functions and their related views are now listed as deprecated which means they may be removed in a future release. Many of you know that DB2 9.7 introduced new, more lightweight monitoring functions.
I am not working in DB2 development anymore, but know that maintaining two sets of functions, especially in critical areas like memory management, can be a pain. Marking the old functions as deprecated in a fixpack seems like they will be gone sooner than later. What does it mean for you? Get ready to explore and exploit the new monitoring if you are not already on them. They also integrate well with workload management.
I am not working in DB2 development anymore, but know that maintaining two sets of functions, especially in critical areas like memory management, can be a pain. Marking the old functions as deprecated in a fixpack seems like they will be gone sooner than later. What does it mean for you? Get ready to explore and exploit the new monitoring if you are not already on them. They also integrate well with workload management.
Subscribe to:
Posts (Atom)