Bullish signal on weekly chart
Company announced a dividend of Rs 2.5 per share on Feb 5, 2025 with record date of Feb 13, 2025.
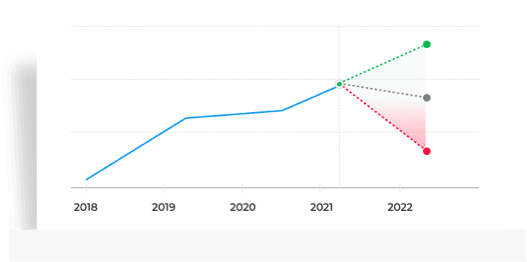
Potential
Upside
1 Year
Target
BUY
Mean Recos by
11 Analysts
/10
Stock Score
| Earnings | |
| Fundamentals | |
| Relative Valuation | |
| Risk | |
| Price Momentum |
Company announced a dividend of Rs 2.5 per share on Feb 5, 2025 with record date of Feb 13, 2025.
Company has no debt since last 5 years. (Source: Consolidated Financials)
Company's annual revenue growth of 15.38% outperformed its 3 year CAGR of 11.06%. (Source: Consolidated Financials)
Stock gave a 3 year return of 17.92% as compared to Nifty Midcap 100 which gave a return of 76.5%. (as of last trading session)
Sun TV Network Ltd. share price moved up by 0.84% from its previous close of Rs 605.60. Sun TV Network Ltd. stock last traded price is 610.65
| Share Price | Value |
|---|---|
| Today/Current/Last | 610.65 |
| Previous Day | 605.60 |
PE Ratio (x) | 13.77 | ||||||||||
EPS - TTM (₹) | 44.34 | ||||||||||
MCap (₹ Cr.) | 24,064.78 | ||||||||||
Sectoral MCap Rank | 1 | ||||||||||
PB Ratio (x) | 2.26 | ||||||||||
Div Yield (%) | 2.74 | ||||||||||
Face Value (₹) | 5.00 | ||||||||||
Beta Beta
| 1.67 | ||||||||||
VWAP (₹) | 611.72 | ||||||||||
52W H/L (₹) |
| 1 Day | 0.84% |
| 1 Week | -3.16% |
| 1 Month | -8.89% |
| 3 Months | -18.0% |
| 1 Year | -1.94% |
| 3 Years | 17.92% |
| 5 Years | 21.12% |
 Stocks in news: Bajaj Auto, Nykaa, Grasim, LIC, Cipla, Hitachi Energy, Sun TV
 Small and midcap stocks down 15% in 4 months, Nuvama shares 20 bottom-up ideas
 BSE 500 cos hold Rs 99,000 cr in cash & cash equivalents. Time for bumper dividends?
Announcement under Regulation 30 (LODR)-Newspaper Publication
AnnouncementsCurrent
Mean Recos by 11 Analysts
| Ratings | Current | 1 Week Ago | 1 Month Ago | 3 Months Ago |
|---|---|---|---|---|
| Strong Buy | 2 | 2 | 2 | 2 |
| Buy | 4 | 4 | 4 | 3 |
| Hold | 4 | 4 | 4 | 4 |
| Sell | 1 | 2 | 2 | 2 |
| Strong Sell | - | - | - | 1 |
| # Analysts | 11 | 12 | 12 | 12 |
Beating 3 Yr Revenue CAGR
Company's annual revenue growth of 15.38% outperformed its 3 year CAGR of 11.06%. (Source: Consolidated Financials)Employee & Interest Expense
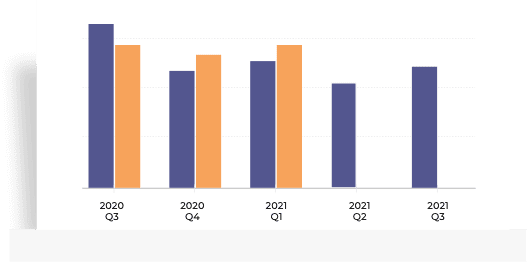
Company has spent less than 1% of its operating revenues towards interest expenses and 7.48% towards employee cost in the year ending Mar 31, 2024. (Source: Consolidated Financials)| Quarterly | Annual | Dec 2024 | Sep 2024 | Jun 2024 | Mar 2024 | Dec 2023 |
|---|---|---|---|---|---|
| Total Income | 967.56 | 1,106.10 | 1,459.20 | 1,098.71 | 1,058.66 |
| Total Income Growth (%) | -12.53 | -24.20 | 32.81 | 3.78 | -8.75 |
| Total Expenses | 496.42 | 589.44 | 706.84 | 546.46 | 449.15 |
| Total Expenses Growth (%) | -15.78 | -16.61 | 29.35 | 21.66 | -16.73 |
| EBIT | 471.14 | 516.66 | 752.36 | 552.26 | 609.51 |
| EBIT Growth (%) | -8.81 | -31.33 | 36.23 | -9.39 | -1.82 |
| Profit after Tax (PAT) | 363.26 | 409.32 | 559.77 | 414.94 | 454.09 |
| PAT Growth (%) | -11.25 | -26.88 | 34.90 | -8.62 | -2.28 |
| EBIT Margin (%) | 48.69 | 46.71 | 51.56 | 50.26 | 57.57 |
| Net Profit Margin (%) | 37.54 | 37.01 | 38.36 | 37.77 | 42.89 |
| Basic EPS (₹) | 9.22 | 10.39 | 14.20 | 10.53 | 11.52 |
All figures in Rs Cr, unless mentioned otherwise
Zero Debt Burden
Company has no debt since last 5 years. (Source: Consolidated Financials)| Annual | FY 2024 | FY 2023 | FY 2022 | FY 2021 | FY 2020 |
|---|---|---|---|---|---|
| Total Assets | 11,420.95 | 10,148.08 | 8,898.10 | 7,946.43 | 6,507.56 |
| Total Assets Growth (%) | 12.54 | 14.05 | 11.98 | 22.11 | 5.00 |
| Total Liabilities | 878.63 | 870.91 | 737.83 | 887.76 | 778.70 |
| Total Liabilities Growth (%) | 0.89 | 18.04 | -16.89 | 14.01 | 16.78 |
| Total Equity | 10,542.32 | 9,277.17 | 8,160.27 | 7,058.67 | 5,728.86 |
| Total Equity Growth (%) | 13.64 | 13.69 | 15.61 | 23.21 | 3.58 |
| Current Ratio (x) | 8.11 | 7.23 | 7.94 | 6.29 | 7.00 |
| Total Debt to Equity (x) | 0.00 | 0.00 | 0.00 | 0.00 | 0.00 |
| Contingent Liabilities | - | 447.87 | 330.17 | 530.22 | 1,409.95 |
All figures in Rs Cr, unless mentioned otherwise
Decrease in Cash from Investing
Company has used Rs 1313.35 cr for investing activities which is an YoY decrease of 15.48%. (Source: Consolidated Financials)| Annual | FY 2024 | FY 2023 | FY 2022 | FY 2021 | FY 2020 |
|---|---|---|---|---|---|
| Net Cash flow from Operating Activities | 2,171.30 | 2,095.51 | 1,633.67 | 1,464.22 | 1,655.62 |
| Net Cash used in Investing Activities | -1,313.35 | -1,553.88 | -987.46 | -1,151.43 | -408.02 |
| Net Cash flow from Financing Activities | -697.05 | -630.63 | -602.73 | -249.46 | -1,222.37 |
| Net Cash Flow | 160.91 | -87.82 | 44.37 | 63.07 | 26.90 |
| Closing Cash & Cash Equivalent | 292.11 | 131.20 | 513.24 | 468.87 | 405.80 |
| Closing Cash & Cash Equivalent Growth (%) | 122.64 | -74.44 | 9.46 | 15.54 | 7.10 |
| Total Debt/ CFO (x) | 0.00 | 0.00 | 0.00 | 0.00 | 0.00 |
All figures in Rs Cr, unless mentioned otherwise
| Annual | FY 2024 | FY 2023 | FY 2022 | FY 2021 | FY 2020 |
|---|---|---|---|---|---|
| Return on Equity (%) | 18.27 | 18.40 | 20.13 | 21.62 | 24.19 |
| Return on Capital Employed (%) | 24.67 | 24.49 | 27.17 | 27.73 | 31.14 |
| Return on Assets (%) | 16.85 | 16.81 | 18.45 | 19.19 | 21.28 |
| Interest Coverage Ratio (x) | 367.19 | 294.06 | 76.49 | 73.50 | 144.03 |
| Asset Turnover Ratio (x) | 0.40 | 0.39 | 0.42 | 39.97 | 54.08 |
| Price to Earnings (x) | 12.30 | 9.61 | 11.78 | 12.15 | 8.13 |
| Price to Book (x) | 2.25 | 1.77 | 2.37 | 2.63 | 1.97 |
| EV/EBITDA (x) | 7.41 | 5.70 | 7.15 | 7.34 | 4.16 |
| EBITDA Margin (%) | 73.40 | 73.43 | 70.95 | 74.86 | 72.06 |
Bullish / Bearish signals for Sun TV basis selected technical indicators and moving average crossovers.
Stochastic Crossover
Bullish signal on weekly chart
Appeared on: 7 Feb 2025
Region: Oversold (Below 20)
| Date | 7 weeks Gain/Loss % |
|---|---|
| 10 Jan 2025 | -0.40% |
| 8 Nov 2024 | 3.67% |
| 13 Sep 2024 | 2.67% |
| 21 Jun 2024 | 7.32% |
Average price gain of 8.67% within 7 weeks of Bullish signal in last 10 years
5 Day EMA Crossover
Bearish signal on daily chart
Appeared on: 7 Feb 2025
5D EMA: 632.37
| Date | 7 days Gain/Loss % |
|---|---|
| 24 Jan 2025 | -4.19% |
| 3 Jan 2025 | -4.78% |
| 17 Dec 2024 | -6.33% |
| 9 Dec 2024 | -5.82% |
Average price decline of -2.45% within 7 days of Bearish signal in last 5 years
| R1 | R2 | R3 | PIVOT | S1 | S2 | S3 | |
|---|---|---|---|---|---|---|---|
| Classic | 618.80 | 626.95 | 644.80 | 609.10 | 600.95 | 591.25 | 573.40 |
| 5 DAYS | 14 DAYS | 28 DAYS | |
|---|---|---|---|
| ATR | 22.77 | 19.39 | 18.80 |
Stock Returns vs Nifty Midcap 100
Stock gave a 3 year return of 17.92% as compared to Nifty Midcap 100 which gave a return of 76.5%. (as of last trading session)Choose from Peers
Choose from Stocks
Stock Returns vs Nifty Midcap 100
Stock gave a 3 year return of 17.92% as compared to Nifty Midcap 100 which gave a return of 76.5%. (as of last trading session)704.70
Amount Invested (in Cr.)
2.64%
% of AUM
0.00
% Change (MoM basis)
222.84
Amount Invested (in Cr.)
2.17%
% of AUM
0.00
% Change (MoM basis)
222.54
Amount Invested (in Cr.)
1.39%
% of AUM
0.00
% Change (MoM basis)
MF Ownership as on 31 December 2024
Price
702.10-12.70 (-1.78%)
Open Interest
64,50023,250 (56.36%)
| Open | High | Low | Prev Close | Contracts Traded | Turnover (₹ Lakhs) |
|---|---|---|---|---|---|
| 706.55 | 714.55 | 702.30 | 714.80 | 49 | 260.73 |
Open Interest as of 11 Feb 2025
Price
128.60-0.00 (1.61%)
Open Interest
5,31,0005,31,000 (0.00%)
| Open | High | Low | Prev Close | Contracts Traded | Turnover (₹ Lakhs) |
|---|---|---|---|---|---|
| 6.05 | 8.90 | 5.75 | 128.60 | 834 | 5,399.48 |
Open Interest as of 11 Feb 2025
| Meeting Date | Announced on | Purpose | Details |
|---|---|---|---|
| Feb 07, 2025 | Feb 03, 2025 | Board Meeting | Quarterly Results & Interim Dividend |
| Dec 31, 2024 | Nov 29, 2024 | POM | - |
| Nov 13, 2024 | Nov 07, 2024 | Board Meeting | Quarterly Results & Interim Dividend |
| Sep 20, 2024 | Aug 09, 2024 | AGM | - |
| Aug 09, 2024 | Aug 01, 2024 | Board Meeting | Quarterly Results & Interim Dividend |
| Type | Dividend | Dividend per Share | Ex-Dividend Date | Announced on |
|---|---|---|---|---|
| Interim | 50% | 2.5 | Feb 13, 2025 | Feb 05, 2025 |
| Interim | 100% | 5.0 | Nov 26, 2024 | Nov 13, 2024 |
| Interim | 100% | 5.0 | Aug 20, 2024 | Aug 07, 2024 |
| Interim | 60% | 3.0 | Apr 08, 2024 | Mar 27, 2024 |
| Interim | 50% | 2.5 | Feb 23, 2024 | Feb 08, 2024 |
| All Types | Ex-Date | Record Date | Announced on | Details |
|---|---|---|---|---|
| Splits | Jul 23, 2007 | - | Apr 05, 2007 | Split: Old FV10.0| New FV:5.0 |
| Bonus | Jul 23, 2007 | - | Apr 24, 2007 | Bonus Ratio: 1 share(s) for every 1 shares held |
Sun TV Network Ltd., incorporated in the year 1985, is a Mid Cap company (having a market cap of Rs 24,064.78 Crore) operating in Media & Entertainment sector. Sun TV Network Ltd. key Products/Revenue Segments include Subscription Income, Income From Advertisement, Other Services, Income from Films Production & Distribution and Income from Content Trading for the year ending 31-Mar-2024. Show More
Kalanithi Maran
Executive ChairmanR Mahesh Kumar
Managing DirectorK Vijaykumar
Executive DirectorKavery Kalanithi
Executive DirectorKey Indices Listed on
Nifty 500, BSE 500, Nifty Media, + 16 more
Address
Murasoli Maran Towers,73, MRC Nagar Main Road,Chennai (Madras), Tamil Nadu - 600028
DATA SOURCES: TickerPlant (for live BSE/NSE quotes service) and Dion Global Solutions Ltd. (for corporate data, historical price & volume, F&O data). Sensex & BSE Quotes and Nifty & NSE Quotes are real-time and licensed from BSE and NSE respectively. All timestamps are reflected in IST (Indian Standard Time).
DISCLAIMER: Any and all content on this website including tools/analysis is provided to you only for convenience and on an “as-is, as- available” basis without representation and warranties of any kind. The content and any output of such tools/analysis is for informational purposes only and should not be relied upon or construed as an investment advice or guarantee for any specific performance/returns advice or considered as recommendation for the purchase or sale of any security or investment. You are advised to exercise caution, discretion and independent judgment with regards to the same and seek advice from professionals and certified experts before taking any decisions.
By using this site, you agree to the Terms of Service and Privacy Policy.