Company has reported a negative ROE for 3 consecutive years. (Source: Standalone Financials)
Loading...
SI Capital & Financial Services Share Price
Advertisment
SI Capital & Fin share price insights
Company has spent 28.68% of its operating revenues towards interest expenses and 48.99% towards employee cost in the year ending Mar 31, 2024. (Source: Standalone Financials)
SI Capital & Financial Services Ltd. share price moved down by -5.00% from its previous close of Rs 51.20. SI Capital & Financial Services Ltd. stock last traded price is 48.64
Share Price Value Today/Current/Last 48.64 Previous Day 51.20
Key Metrics
PE Ratio (x) | -69.95 | ||||||||||
EPS - TTM (₹) | -0.70 | ||||||||||
MCap (₹ Cr.) | 21.89 | ||||||||||
Sectoral MCap Rank | 297 | ||||||||||
PB Ratio (x) | 7.78 | ||||||||||
Div Yield (%) | 0.00 | ||||||||||
Face Value (₹) | 10.00 | ||||||||||
Beta Beta
| - | ||||||||||
VWAP (₹) | 48.64 | ||||||||||
52W H/L (₹) |
SI Capital & Fin Share Price Returns
| 1 Day | -5.0% |
| 1 Week | N.A. |
| 1 Month | N.A. |
| 3 Months | N.A. |
| 1 Year | N.A. |
| 3 Years | N.A. |
| 5 Years | N.A. |
SI Capital & Fin News & Analysis
SI Capital & Fin Share Analysis
Unlock Stock Score, Analyst' Ratings & Recommendations
- View Stock Score on a 10-point scale
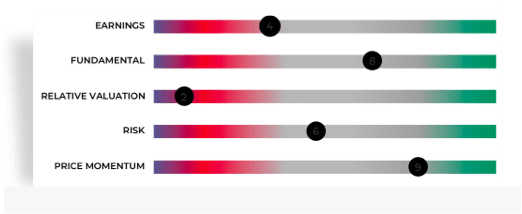
- See ratings on Earning, Fundamentals, Valuation, Risk & Price
- Check stock performance
JOIN ET PRIME
SI Capital & Fin Share Recommendations
No Recommendations details available for this stock.
Check out other stock recos.
SI Capital & Fin Financials
Insights
Employee & Interest Expense
Company has spent 28.68% of its operating revenues towards interest expenses and 48.99% towards employee cost in the year ending Mar 31, 2024. (Source: Standalone Financials)
Quarterly | Annual Dec 2024 Sep 2024 Jun 2024 Mar 2024 Dec 2023 Total Income 0.66 0.62 0.55 0.52 0.49 Total Income Growth (%) 6.08 12.39 6.38 5.12 19.98 Total Expenses 0.32 0.38 0.66 0.57 0.54 Total Expenses Growth (%) -15.83 -41.72 14.99 5.73 31.07 EBIT 0.34 0.24 -0.11 -0.05 -0.05 EBIT Growth (%) 41.52 - - - - Profit after Tax (PAT) 0.16 0.05 -0.29 -0.22 -0.19 PAT Growth (%) 249.12 - - - - EBIT Margin (%) 50.96 38.20 -19.18 -10.25 -9.62 Net Profit Margin (%) 24.08 7.32 -53.00 -43.20 -38.77 Basic EPS (₹) 0.35 0.10 -0.66 -0.64 -0.53 All figures in Rs Cr, unless mentioned otherwise
Annual FY 2024 FY 2023 FY 2022 FY 2021 FY 2020 Total Assets 10.19 5.99 3.50 3.46 2.84 Total Assets Growth (%) 70.12 71.14 1.16 21.83 -1.73 Total Liabilities 7.23 2.69 1.07 0.91 0.09 Total Liabilities Growth (%) 168.77 151.40 17.58 911.11 12.50 Total Equity 2.96 3.29 2.42 2.55 2.75 Total Equity Growth (%) -10.03 35.95 -5.10 -7.27 -2.14 Current Ratio (x) 1.37 2.15 65.99 37.51 36.15 Total Debt to Equity (x) 2.30 0.70 0.40 0.32 0.00 Contingent Liabilities - - - - - All figures in Rs Cr, unless mentioned otherwise
Annual FY 2024 FY 2023 FY 2022 FY 2021 FY 2020 Net Cash flow from Operating Activities -4.59 -2.70 -0.40 -1.94 -0.35 Net Cash used in Investing Activities -0.12 0.24 -0.23 0.91 -0.24 Net Cash flow from Financing Activities 4.87 2.46 0.17 1.01 - Net Cash Flow 0.15 0.01 -0.47 -0.02 -0.59 Closing Cash & Cash Equivalent 0.61 0.46 0.45 0.92 0.94 Closing Cash & Cash Equivalent Growth (%) 33.89 1.40 -51.02 -2.60 -38.28 Total Debt/ CFO (x) -1.48 -0.86 -2.43 -0.42 0.00 All figures in Rs Cr, unless mentioned otherwise
Insights
Losing Shareholder's Money
Company has reported a negative ROE for 3 consecutive years. (Source: Standalone Financials)
Annual FY 2024 FY 2023 FY 2022 FY 2021 FY 2020 Return on Equity (%) -24.18 -2.95 -5.19 -15.68 -2.21 Return on Capital Employed (%) -7.21 0.82 -0.88 -10.89 -1.78 Return on Assets (%) -7.02 -1.62 -3.60 -11.55 -2.14 Interest Coverage Ratio (x) -0.30 0.44 0.04 -9.81 -9.59 Asset Turnover Ratio (x) 0.21 0.19 0.17 0.11 0.12 Price to Earnings (x) -12.33 -135.14 -71.94 -17.18 -71.43 Price to Book (x) 2.98 3.97 3.71 2.69 1.57 EV/EBITDA (x) -99.97 269.28 2,645.72 -20.50 -76.56 EBITDA Margin (%) -8.68 6.07 0.61 -92.63 -13.01
SI Capital & Fin Technicals
Stock doesn't have any Buy/Sell Signals.
Price Analysis Data details are not available.
Pivot Levels
R1 R2 R3 PIVOT S1 S2 S3 Classic - - - - - - - Average True Range
5 DAYS 14 DAYS 28 DAYS ATR - - -
SI Capital & Fin Peer Comparison
Choose from Peers
Choose from Stocks
- 1D
- 1W
- 1M
- 3M
- 6M
- 1Y
- 5Y
Loading...- See All Parameters
SI Capital & Fin MF Ownership
MF Ownership details are not available.
SI Capital & Fin Corporate Actions
Meeting Date Announced on Purpose Details Jan 21, 2025 Jan 13, 2025 Board Meeting Quarterly Results Nov 04, 2024 Oct 28, 2024 Board Meeting Quarterly Results Sep 20, 2024 Aug 13, 2024 AGM - Aug 13, 2024 Aug 07, 2024 Board Meeting Quarterly Results May 28, 2024 May 23, 2024 Board Meeting Audited Results Dividend announcements are not available.
No other corporate actions details are available.
About SI Capital & Fin
SI Capital & Financial Services Ltd., incorporated in the year 1994, is a Small Cap company (having a market cap of Rs 21.89 Crore) operating in Financial Services sector. SI Capital & Financial Services Ltd. key Products/Revenue Segments include Interest and Other Services for the year ending 31-Mar-2024. Show More
Executives
Auditors
- VM
Vinod Manazhy
Chairman & Ind.DirectorJAJayson A Mekkattukulam
Chief Executive OfficerAMAnil Menon
Non Executive DirectorATAnu Thomas Cheriyan
Non Executive DirectorShow More - Ayyar & CherianA M Thomas
Industry
Key Indices Listed on
-
Address
No.27 First Floor,New Scheme Road,Pollachi, Tamil Nadu - 642001
More Details
FAQs about SI Capital & Fin share
- 1. What is SI Capital & Fin share price and what are the returns for SI Capital & Fin share?As on 24 Feb, 2025, 03:31 PM IST SI Capital & Fin share price is down by 5.00% basis the previous closing price of Rs 51.2. SI Capital & Fin share price is Rs 48.64.
- 2. Who are peers to compare SI Capital & Fin share price?Within Financial Services sector SI Capital & Fin, Inditrade Capital Ltd., First Custodian Fund (India) Ltd., Daulat Securities Ltd., Tokyo Finance Ltd., Neil Industries Ltd., GSB Finance Ltd., Maharashtra Corporation Ltd., Onelife Capital Advisors Ltd., Mansi Finance (Chennai) Ltd. and Moongipa Capital Finance Ltd. are usually compared together by investors for analysis.
- 3. What are the key metrics to analyse SI Capital & Fin Share Price?SI Capital & Fin share can be quickly analyzed on following metrics:
- Stock's PE is -69.95
- Price to Book Ratio of 7.78
- 4. What are the SI Capital & Fin quarterly results?On Standalone basis, SI Capital & Fin reported a total income and profit of Rs 0.66 Cr and Rs 0.16 respectively for quarter ending resultQuarterlyResult.list[0].yearEnding. Total Income and loss for the year ending 2024-03-31 was Rs 1.77 Cr and Rs -0.72 Cr.
- 5. What is the market cap of SI Capital & Fin?SI Capital & Fin share has a market capitalization of Rs 21.89 Cr. Within Financial Services sector, it's market cap rank is 297.
- 6. Who's the owner of SI Capital & Fin?Promoter, owns 40.96, shares of SI Capital & Fin as on 31 Dec 2024
- There is no change in promoter holding from 30 Sep 2024 to 31 Dec 2024
- There is no change in Other investor holding from 30 Sep 2024 to 31 Dec 2024
- 7. Who's the chairman of SI Capital & Fin?Vinod Manazhy is the Chairman & Ind.Director of SI Capital & Fin
- 8. What is 52 week high/low of SI Capital & Fin share price?SI Capital & Fin share price saw a 52 week high of Rs 51.37 and 52 week low of Rs 24.49.
- 9. What is the PE & PB ratio of SI Capital & Fin?The PE ratio of SI Capital & Fin stands at -69.95, while the PB ratio is 5.92.
- 10. What is the CAGR of SI Capital & Fin?The CAGR of SI Capital & Fin is 48.45.
Trending in Markets
Top Gainers As on 03:59 PM | 07 Mar 2025
Top Losers As on 03:59 PM | 07 Mar 2025
SI Capital & Fin Quick Links
Equity Quick Links
More from Markets
IPOStock market news
Budget 2022 Live Updates
Cryptocurrency
Currency converter
NSE holiday list
DATA SOURCES: TickerPlant (for live BSE/NSE quotes service) and Dion Global Solutions Ltd. (for corporate data, historical price & volume, F&O data). Sensex & BSE Quotes and Nifty & NSE Quotes are real-time and licensed from BSE and NSE respectively. All timestamps are reflected in IST (Indian Standard Time).
DISCLAIMER: Any and all content on this website including tools/analysis is provided to you only for convenience and on an “as-is, as- available” basis without representation and warranties of any kind. The content and any output of such tools/analysis is for informational purposes only and should not be relied upon or construed as an investment advice or guarantee for any specific performance/returns advice or considered as recommendation for the purchase or sale of any security or investment. You are advised to exercise caution, discretion and independent judgment with regards to the same and seek advice from professionals and certified experts before taking any decisions.
By using this site, you agree to the Terms of Service and Privacy Policy.