Maharashtra Seam. - Maharashtra Seamless Share Price

  • 654.3035.50 (5.74%)
  • Volume: 8,48,304
  • Closed
  • Last Updated On: 06 Feb, 2025, 03:29 PM IST
Loading...

Maharashtra Seam. - Maharashtra Seamless Share Price

  • 654.3035.50 (5.74%)
  • Volume: 8,48,304
Advertisment

Stock Recommendations

  • Potential
    Upside

  • 1 Year
    Target

BUY

Mean Recos by
2 Analysts

0

0

1

1

0

Strong Sell

Sell

Hold

Buy

Strong Buy

Unlock Potential Upside

Stock Reports Plus

/10

Stock Score

View Report
Earnings
Fundamentals
Relative Valuation
Risk
Price Momentum
No Rating (NR)
Negative
Neutral
Positive
Unlock Stock Score

Maharashtra Seam. share price insights

View All
  • In the last 20 years, only 2.71 % trading sessions saw intraday gains higher than 5 % .
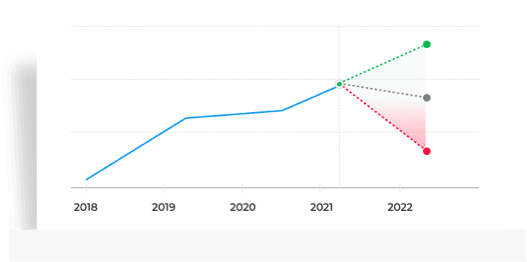
  • Company has become debt free for the first time since last 5 years. (Source: Consolidated Financials)

  • Sales de-grew by 4.46%. Company witnessed revenue contraction for the first time in last 3 years. (Source: Consolidated Financials)

  • 20 day moving crossover appeared yesterday. Average price gain of 4.23% within 7 days of this signal in last 5 years.

  • Maharashtra Seamless Ltd. share price moved up by 5.74% from its previous close of Rs 618.80. Maharashtra Seamless Ltd. stock last traded price is 654.30

    Share PriceValue
    Today/Current/Last654.30
    Previous Day618.80620.20

InsightsMaharashtra Seam.

    Do you find these insights useful?

    • hate it

    • meh

    • love it

    Key Metrics

    PE Ratio
    (x)
    11.63
    EPS - TTM
    (₹)
    56.25
    MCap
    (₹ Cr.)
    8,767.57
    Sectoral MCap Rank
    19
    PB Ratio
    (x)
    1.45
    Div Yield
    (%)
    1.53
    Face Value
    (₹)
    5.00
    Beta

    Beta

    1 Month0.37
    3 Months0.47
    6 Months0.53
    1 Year0.79
    3 Years1.00

    0.37
    VWAP
    (₹)
    647.18
    52W H/L
    (₹)
    1,049.00 / 566.50

    Maharashtra Seam. Share Price Returns

    1 Day5.74%
    1 Week5.82%
    1 Month-7.88%
    3 Months0.37%
    1 Year-36.32%
    3 Years131.39%
    5 Years237.66%

    ET Stock ScreenersTop Score Companies

    Check whether Maharashtra Seam. belongs to analysts' top-rated companies list?

    View Stock Screeners

    Maharashtra Seam. Share Recommendations

    Recent Recos

    BUY

    Current

    Mean Recos by 2 Analysts

    Strong
    Sell
    SellHoldBuyStrong
    Buy
    • Target₹580
    • OrganizationEdelweiss Financial Services
    • BUY
    • Target₹535
    • OrganizationPrabhudas Lilladher
    • BUY

    Analyst Trends

    RatingsCurrent1 Week Ago1 Month Ago3 Months Ago
    Strong Buy----
    Buy1111
    Hold1111
    Sell----
    Strong Sell----
    # Analysts2222

    Maharashtra Seam. Financials

    • Insights

      • Topline Contraction

        Sales de-grew by 4.46%. Company witnessed revenue contraction for the first time in last 3 years. (Source: Consolidated Financials)
      • Employee & Interest Expense

        Company has spent less than 1% of its operating revenues towards interest expenses and 2.02% towards employee cost in the year ending Mar 31, 2024. (Source: Consolidated Financials)
      Quarterly | AnnualDec 2024Sep 2024Jun 2024Mar 2024Dec 2023
      Total Income1,409.831,382.541,215.781,258.901,465.94
      Total Income Growth (%)1.9713.72-3.43-14.12-6.34
      Total Expenses1,153.801,086.011,051.53963.611,086.88
      Total Expenses Growth (%)6.243.289.12-11.34-11.53
      EBIT256.03296.53164.25295.29379.06
      EBIT Growth (%)-13.6680.54-44.38-22.1012.61
      Profit after Tax (PAT)186.07220.08129.27218.37275.95
      PAT Growth (%)-15.4570.25-40.80-20.8710.18
      EBIT Margin (%)18.1621.4513.5123.4625.86
      Net Profit Margin (%)13.2015.9210.6317.3518.82
      Basic EPS (₹)13.8916.429.6516.3020.59
      Quarterly | AnnualDec 2024Sep 2024Jun 2024Mar 2024Dec 2023
      Total Income1,409.541,381.991,215.561,258.681,465.14
      Total Income Growth (%)1.9913.69-3.43-14.09-6.35
      Total Expenses1,153.171,085.301,049.81963.481,086.01
      Total Expenses Growth (%)6.253.388.96-11.28-11.53
      EBIT256.37296.69165.75295.20379.13
      EBIT Growth (%)-13.5979.00-43.85-22.1412.55
      Profit after Tax (PAT)190.17224.20135.95223.29280.29
      PAT Growth (%)-15.1864.91-39.12-20.349.67
      EBIT Margin (%)18.1921.4713.6423.4525.88
      Net Profit Margin (%)13.4916.2211.1817.7419.13
      Basic EPS (₹)14.1916.7310.1516.6620.92
      Quarterly | Annual FY 2024 FY 2023 FY 2022 FY 2021 FY 2020
      Total Revenue5,546.305,805.244,311.152,395.752,694.79
      Total Revenue Growth (%)-4.4634.6679.95-11.10-14.22
      Total Expenses4,300.904,852.153,776.652,020.122,256.11
      Total Expenses Growth (%)-11.3628.4886.95-10.46-10.56
      Profit after Tax (PAT)951.30764.75380.2098.0483.87
      PAT Growth (%)24.39101.15287.8116.89-64.19
      Operating Profit Margin (%)23.2017.3413.9318.6819.00
      Net Profit Margin (%)17.6013.379.054.243.17
      Basic EPS (₹)70.9957.0756.7514.6312.52
      Quarterly | Annual FY 2024 FY 2023 FY 2022 FY 2021 FY 2020
      Total Revenue5,544.295,790.013,644.322,315.722,667.95
      Total Revenue Growth (%)-4.2458.8857.37-13.20-14.77
      Total Expenses4,298.204,840.943,162.821,932.052,192.11
      Total Expenses Growth (%)-11.2153.0663.70-11.86-12.01
      Profit after Tax (PAT)974.93792.99380.44141.59-20.68
      PAT Growth (%)22.94108.44168.69--107.88
      Operating Profit Margin (%)23.2117.2514.6619.4020.01
      Net Profit Margin (%)18.0413.8910.696.36-0.79
      Basic EPS (₹)72.7659.1856.7821.13-3.09

      All figures in Rs Cr, unless mentioned otherwise

    • Insights

      • All Debts Paid-off

        Company has become debt free for the first time since last 5 years. (Source: Consolidated Financials)
      Annual FY 2024 FY 2023 FY 2022 FY 2021 FY 2020
      Total Assets6,587.855,858.785,387.655,355.625,239.38
      Total Assets Growth (%)12.448.740.602.229.27
      Total Liabilities857.151,084.811,691.042,056.822,034.69
      Total Liabilities Growth (%)-20.99-35.85-17.781.0917.97
      Total Equity5,730.704,773.963,696.613,298.803,204.68
      Total Equity Growth (%)20.0429.1412.062.944.38
      Current Ratio (x)8.405.903.152.041.89
      Total Debt to Equity (x)0.000.050.190.280.36
      Contingent Liabilities723.97807.85977.651,080.691,589.86
      Annual FY 2024 FY 2023 FY 2022 FY 2021 FY 2020
      Total Assets6,464.985,784.325,091.495,137.214,918.16
      Total Assets Growth (%)11.7713.61-0.894.4513.54
      Total Liabilities851.121,078.461,489.291,893.611,801.33
      Total Liabilities Growth (%)-21.08-27.59-21.355.1257.25
      Total Equity5,613.864,705.863,602.203,243.603,116.82
      Total Equity Growth (%)19.3030.6411.064.07-2.18
      Current Ratio (x)8.395.893.562.062.58
      Total Debt to Equity (x)0.000.050.180.220.26
      Contingent Liabilities723.97807.85977.651,080.691,589.86

      All figures in Rs Cr, unless mentioned otherwise

    • Insights

      • Increase in Cash from Investing

        Company has used Rs 721.62 cr for investing activities which is an YoY increase of 88.84%. (Source: Consolidated Financials)
      Annual FY 2024 FY 2023 FY 2022 FY 2021 FY 2020
      Net Cash flow from Operating Activities1,041.42911.80-287.10447.41747.95
      Net Cash used in Investing Activities-721.62-382.14565.27-178.35-743.84
      Net Cash flow from Financing Activities-319.66-542.08-291.38-284.797.35
      Net Cash Flow0.11-16.56-15.63-20.8325.21
      Closing Cash & Cash Equivalent54.5254.4247.4863.1183.94
      Closing Cash & Cash Equivalent Growth (%)0.1914.62-24.77-24.8142.92
      Total Debt/ CFO (x)0.000.27-2.472.061.53
      Annual FY 2024 FY 2023 FY 2022 FY 2021 FY 2020
      Net Cash flow from Operating Activities1,047.50907.88-289.84500.67748.70
      Net Cash used in Investing Activities-722.23-466.49425.05-307.06-1,026.68
      Net Cash flow from Financing Activities-319.63-457.09-145.92-146.22220.57
      Net Cash Flow5.64-15.70-10.7147.40-57.41
      Closing Cash & Cash Equivalent53.5647.9237.1447.850.45
      Closing Cash & Cash Equivalent Growth (%)11.7729.04-22.390.00-99.22
      Total Debt/ CFO (x)0.000.27-2.181.431.07

      All figures in Rs Cr, unless mentioned otherwise

    • Insights

      • Building-up Cash Reserves

        Company has consistently increased ROE in last 5 years with majority of profits being added to its reserves last year. (Source: Consolidated Financials)
      Annual FY 2024 FY 2023 FY 2022 FY 2021 FY 2020
      Return on Equity (%)16.5715.9810.282.972.65
      Return on Capital Employed (%)20.3618.6512.8610.0111.75
      Return on Assets (%)14.4413.057.051.831.60
      Interest Coverage Ratio (x)160.9929.4614.267.747.86
      Asset Turnover Ratio (x)0.871.020.6843.1050.47
      Price to Earnings (x)11.926.279.7318.8715.46
      Price to Book (x)1.971.001.000.560.41
      EV/EBITDA (x)8.264.406.024.914.06
      EBITDA Margin (%)25.2319.7517.2123.9422.32
      Annual FY 2024 FY 2023 FY 2022 FY 2021 FY 2020
      Return on Equity (%)17.3716.8610.564.36-0.66
      Return on Capital Employed (%)20.7818.7811.7210.3412.70
      Return on Assets (%)15.0813.707.472.75-0.42
      Interest Coverage Ratio (x)161.5931.3815.738.9910.93
      Asset Turnover Ratio (x)0.881.050.7043.3153.20
      Price to Earnings (x)11.636.059.7213.05-62.89
      Price to Book (x)2.021.021.030.570.42
      EV/EBITDA (x)8.274.456.834.683.48
      EBITDA Margin (%)25.2419.6317.6524.1323.02

    Financial InsightsMaharashtra Seam.

    • Income (P&L)
    • Balance Sheet
    • Cash Flow
    • Ratios
      • Topline Contraction

        Sales de-grew by 4.46%. Company witnessed revenue contraction for the first time in last 3 years. (Source: Consolidated Financials)

      • Employee & Interest Expense

        Company has spent less than 1% of its operating revenues towards interest expenses and 2.02% towards employee cost in the year ending Mar 31, 2024. (Source: Consolidated Financials)

      • All Debts Paid-off

        Company has become debt free for the first time since last 5 years. (Source: Consolidated Financials)

      • Increase in Cash from Investing

        Company has used Rs 721.62 cr for investing activities which is an YoY increase of 88.84%. (Source: Consolidated Financials)

      • Building-up Cash Reserves

        Company has consistently increased ROE in last 5 years with majority of profits being added to its reserves last year. (Source: Consolidated Financials)

    Do you find these insights useful?

    • hate it

    • meh

    • love it

    Maharashtra Seam. Share Price Forecast

    • Get multiple analysts’ prediction on Maharashtra Seam.

      Stock Forecast Non Prime User
      • High, low, medium predictions for Price
      • Upcoming predictions for Revenue
      • Details about company earnings
      START FREE TRIAL
    • Get multiple analysts’ prediction on Maharashtra Seam.

      Stock Forecast Non Prime User
      • High, low, medium predictions for Price
      • Upcoming predictions for Revenue
      • Details about company earnings
      START FREE TRIAL
    • Get multiple analysts’ prediction on Maharashtra Seam.

      Stock Forecast Non Prime User
      • High, low, medium predictions for Price
      • Upcoming predictions for Revenue
      • Details about company earnings
      START FREE TRIAL

    Maharashtra Seam. Technicals

    • Bullish / Bearish signals for Maharashtra Seam. basis selected technical indicators and moving average crossovers.

      10 Day EMA Crossover

      Bullish signal on daily chart

      Appeared on: 6 Feb 2025

      10D EMA: 627.88

      Last 4 Buy Signals:1 Jan 2025
      Date7 days Gain/Loss %
      1 Jan 2025-0.36%
      21 Nov 20244.59%
      29 Oct 20246.48%
      13 Sep 20241.52%

      Average price gain of 4.34% within 7 days of Bullish signal in last 5 years

      14 Day EMA Crossover

      Bullish signal on daily chart

      Appeared on: 6 Feb 2025

      14D EMA: 631.36

      Last 4 Buy Signals:7 Jan 2025
      Date7 days Gain/Loss %
      7 Jan 20250.31%
      1 Jan 2025-0.36%
      19 Dec 2024-0.06%
      21 Nov 20244.59%

      Average price gain of 4.05% within 7 days of Bullish signal in last 5 years

      Show More
    • 43%
      Positive Movement since
      1st Jan 2005 on basis
      57%
      Negative Movement since
      1st Jan 2005 on basis
      Exclude
    • Pivot Levels

      R1R2R3PIVOTS1S2S3
      Classic670.22686.13727.68644.58628.67603.03561.48

      Average True Range

      5 DAYS14 DAYS28 DAYS
      ATR26.9626.2725.72

    Maharashtra Seam. Peer Comparison

      • There’s no suggested peer for this stock.
      • 1D
      • 1W
      • 1M
      • 3M
      • 6M
      • 1Y
      • 5Y
      Loading...
    • Ratio Performance

      NAMEP/E (x)P/B (x)ROE %ROCE %ROA %Rev CAGR [3Yr]OPMNPMBasic EPSCurrent RatioTotal Debt/ Equity (x)Total Debt/ CFO (x)
      Maharashtra Seam.11.631.5316.5720.3614.4431.9223.2018.0270.998.400.000.00
      Add More stocks of your interest to compare.
      Annual Ratios (%)

      Choose from Peers

        Choose from Stocks

        Peers InsightsMaharashtra Seam.

        • Stock Returns vs Nifty Midcap 100

          Stock gave a 3 year return of 118.83% as compared to Nifty Midcap 100 which gave a return of 76.78%. (as of last trading session)

        Do you find these insights useful?

        • hate it

        • meh

        • love it

        Maharashtra Seam. Shareholding Pattern

        • Loading...
          Showing Maharashtra Seam. Shareholding as on Dec 2024
          CategoryDec 2024Sep 2024Jun 2024Mar 2024
          Promoters68.0768.0468.0068.00
          Pledge0.000.000.000.00
          FII9.127.979.2311.95
          DII3.814.345.263.81
          Mutual Funds3.023.564.192.54
          Others19.0019.6417.5016.23
        • Showing Shareholding as on Dec 2024
          CategoryNo. of SharesPercentage% Change QoQ
          Promoters9,12,07,37968.07 %0.02
          Pledge00.00 %0.00
          FII1,22,16,9089.12 %1.14
          DII51,19,6943.81 %-0.52
          MF40,51,2693.02 %-0.54
          Others2,54,55,27119.00 %-0.64

        Maharashtra Seam. MF Ownership

        MF Ownership as on 31 December 2024

        Maharashtra Seam. Corporate Actions

        • Meeting DateAnnounced onPurposeDetails
          Jan 27, 2025Jan 15, 2025Board MeetingQuarterly Results & Others
          Oct 28, 2024Oct 17, 2024Board MeetingQuarterly Results
          Aug 28, 2024May 22, 2024AGM-
          Jul 29, 2024Jul 19, 2024Board MeetingQuarterly Results
          May 21, 2024May 13, 2024Board MeetingAudited Results & Dividend
        • TypeDividendDividend per ShareEx-Dividend DateAnnounced on
          Final200%10.0Aug 14, 2024May 21, 2024
          Final100%5.0Aug 14, 2023May 26, 2023
          Final100%5.0Sep 07, 2022May 27, 2022
          Final70%3.5Sep 14, 2021Jun 25, 2021
          Final50%2.5Sep 14, 2020Aug 10, 2020
        • All TypesEx-DateRecord DateAnnounced onDetails
          BonusNov 25, 2022Nov 28, 2022Oct 17, 2022Bonus Ratio: 1 share(s) for every 1 shares held
          SplitsApr 18, 2006Apr 25, 2006Feb 06, 2006Split: Old FV10.0| New FV:5.0
          Splits--Jul 30, 2007Split: Old FV5.0| New FV:2.0

        About Maharashtra Seam.

        Maharashtra Seamless Ltd., incorporated in the year 1988, is a Mid Cap company (having a market cap of Rs 8,767.57 Crore) operating in Metals - Ferrous sector. Maharashtra Seamless Ltd. key Products/Revenue Segments include Pipes & Tubes Steel and Scrap for the year ending 31-Mar-2024. Show More

        • Executives

        • Auditors

        • DP

          D P Jindal

          Chairman
          SJ

          Saket Jindal

          Managing Director
          RJ

          Raghav Jindal

          Joint Managing Director
          AB

          Ashok Bhandari

          Director
          Show More
        • Kanodia Sanyal & Associates
          L B Jha & Co.

        FAQs about Maharashtra Seam. share

        • 1. What is Maharashtra Seam. share price and what are the returns for Maharashtra Seam. share?
          Maharashtra Seam. share price is Rs 654.30 as of today. Maharashtra Seam. share price is up by 5.74% based on previous share price of Rs 621.7. Maharashtra Seam. share price trend:
          • Last 3 Months: Maharashtra Seam. share price moved up by 0.37%
          • Last 3 Years: Maharashtra Seam. Share price moved up by 131.39%
        • 2. Who is the chairman of Maharashtra Seam.?
          D P Jindal is the Chairman of Maharashtra Seam.
        • 3. Who owns Maharashtra Seam.?
          Following are the key changes to Maharashtra Seam. shareholding:
          • Promoter holding has gone up from 68.0 (31 Mar 2024) to 68.07 (31 Dec 2024)
          • Domestic Institutional Investors holding has not changed in last 9 months and holds 3.81 stake as on 31 Dec 2024
          • Foreign Institutional Investors holding have gone down from 11.95 (31 Mar 2024) to 9.12 (31 Dec 2024)
          • Other investor holding has gone up from 16.23 (31 Mar 2024) to 19.0 (31 Dec 2024)
        • 4. What are the Maharashtra Seam. quarterly results?
          On Consoldiated basis, Maharashtra Seam. reported a total income and profit of Rs 1409.83 Cr and Rs 186.07 respectively for quarter ending 2024-12-31. Total Income and profit for the year ending 2024-03-31 was Rs 5546.30 Cr and Rs 951.30 Cr.
        • 5. What is the PE & PB ratio of Maharashtra Seam.?
          The PE ratio of Maharashtra Seam. stands at 11.0, while the PB ratio is 1.45.
        • 6. What is the CAGR of Maharashtra Seam.?
          The CAGR of Maharashtra Seam. is 23.7.
        • 7. What dividend is Maharashtra Seam. giving?
          An equity Final dividend of Rs 10 per share was declared by Maharashtra Seamless Ltd. on 21 May 2024. So, company has declared a dividend of 200% on face value of Rs 5 per share. The ex dividend date was 14 Aug 2024.
        • 8. What is the recommendation for Maharashtra Seam. - Buy or Sell?
          As per Refinitiv (erstwhile Thomson Reuters), overall mean recommendation by 2 analysts for Maharashtra Seam. stock is to Buy. Recommendation breakup is as follows
          • 1 analyst is recommending to Buy
          • 1 analyst is recommending to Hold
        • 9. What are the returns for Maharashtra Seam. share?
          Return Performance of Maharashtra Seam. Shares:
          • 1 Week: Maharashtra Seam. share price moved up by 5.82%
          • 3 Month: Maharashtra Seam. share price moved up by 0.37%
        • 10. How can I quickly analyze Maharashtra Seam. stock?
          Maharashtra Seam. share can be quickly analyzed on following metrics:
          • Stock's PE is 11.63
          • Price to Book Ratio of 1.45
        • 11. What's the market capitalization of Maharashtra Seam.?
          Within the Metals - Ferrous sector, Maharashtra Seam. stock has a market cap rank of 19. Maharashtra Seam. has a market cap of Rs 8,767.57 Cr.
        • 12. What has been highest price of Maharashtra Seam. share in last 52 weeks?
          In last 52 weeks Maharashtra Seam. share had a high price of Rs 1,049.00 and low price of Rs 566.50

        Trending in Markets

        Top Gainers As on 03:59 PM | 06 Feb 2025

        GSK Pharma2,260.65
        261.31 (13.07%)
        Castrol India210.10
        16.07 (8.28%)
        JK Lakshmi Cement839.45
        55.75 (7.12%)
        Redington228.00
        13.66 (6.38%)
        Maharashtra Seam.654.30
        35.50 (5.74%)

        Top Losers As on 03:59 PM | 06 Feb 2025

        Trent5,277.10
        -472.85 (-8.23%)
        Solar Ind.9,115.00
        -538.75 (-5.59%)
        Macrotech Developers1,198.70
        -69.71 (-5.50%)
        Hindustan Zinc442.90
        -24.56 (-5.26%)
        Phoenix Mills1,615.60
        -84.41 (-4.97%)

        DATA SOURCES: TickerPlant (for live BSE/NSE quotes service) and Dion Global Solutions Ltd. (for corporate data, historical price & volume, F&O data). Sensex & BSE Quotes and Nifty & NSE Quotes are real-time and licensed from BSE and NSE respectively. All timestamps are reflected in IST (Indian Standard Time).

        DISCLAIMER: Any and all content on this website including tools/analysis is provided to you only for convenience and on an “as-is, as- available” basis without representation and warranties of any kind. The content and any output of such tools/analysis is for informational purposes only and should not be relied upon or construed as an investment advice or guarantee for any specific performance/returns advice or considered as recommendation for the purchase or sale of any security or investment. You are advised to exercise caution, discretion and independent judgment with regards to the same and seek advice from professionals and certified experts before taking any decisions.

        By using this site, you agree to the Terms of Service and Privacy Policy.

        The Economic Times